- NILnomics
- Posts
- CFB Stadium Sizes, Ranked
CFB Stadium Sizes, Ranked
Size doesn't matter but leave it to an analyst to measure anyways
Greg Chick
June 27, 2025

Alot of great responses to last week’s newsletter. I enjoyed my collab with the Sickos Committee (shout out to their newsletter) so much that I’m jumping in again. Today there’ll be:
CFB Stadium sizes - I gathered all the data on how big these coliseums are.
Don’t forget the bacon - another collab with the Sickos. This time on proximity to Waffle House. No, really.
College hockey - let’s look at how many people are watching college hockey
Pour a drink. Get comfortable. Let’s get into it.
If you’re not subscribed already, please click subscribe below to get NILnomics in your mailbox each and every week - it’s free!
College Football Stadiums - Size Matters
As a sports fan, I love traveling to every arena I can. I’ve been to a few - Wrigley Field, the Bell Centre, Notre Dame Stadium, and Gillette Stadium to name a few. I think like most sports fans, I have a bucket list of places to go. In my mind, I always wanted to hit some of those big European soccer stadiums. Whether it’s Santiago Bernabéu Stadium or Old Trafford, the bigger the better (and having history and a big fan culture helps, too).
This is the point where, if you don’t know, I have to admit I’m a MAC grad. I’ve only ever been to Notre Dame Stadium outside the Doyt. So when I started digging into the other arenas out there, I was blown away by 1) the size of these places and 2) how old they are. I’ll follow up on the age in another issue, but this week let’s take a look at the size of the stadiums around the FBS:

Quick Takeaways:
The B1G may have the three biggest arenas (hello Ohio State, Michigan, and Penn State!) but the SEC just has better consistency across the conference. This can be seen in the average capacity, where the SEC is the highest with 81,188 and B1G is 71,378.
If I had sorted by average capacity in each conference, the Big 12 would be 5th whereas here it’s 7th. South Florida and UNLV are doing alot of lifting here, propelling the American and Mountain West conferences higher on my ranking.
So much can be said about the demise of the Pac-12, but the fact they can’t move ahead of any other conference here is incredibly stark.
Yes, Kennesaw has the lowest capacity at 10,200.
Analyst’s Desk
Pretty straightforward here. I went on Wikipedia (*sigh*, I know) and gathered the capacity listed at each FBS arena. The graph is sorted by conference with the highest individual capacity, and then sorted on capacity within that conference. I’ll note that I used the projected capacity for Northwestern’s new arena that is planned to open in 2026.
Sicks Part Deux 🤡
After last week’s successful collaboration with the Sickos Committee, I thought we’d have some time apart before another opportunity popped up. Hopefully by now you’re reading their newsletter, listening to their podcast, and following them on socials. Recently, they had two interesting posts on X that were data centric. I didn’t look at them too much - one listing the college football stadiums closest to an airport and then closest to a Waffle House.
Normally these topics wouldn’t peak my interest nor inspire me to validate them and make a visual out of it. But in an unbelievable coincidence - the Bowling Green State University Falcons were #1 in both categories! As an alum of BGSU, I thought I had to do my part to 1) confirm this data and 2) spread the news.
With that said, let’s dig into the more important/practical of the two - closest stadium to a Waffle House:
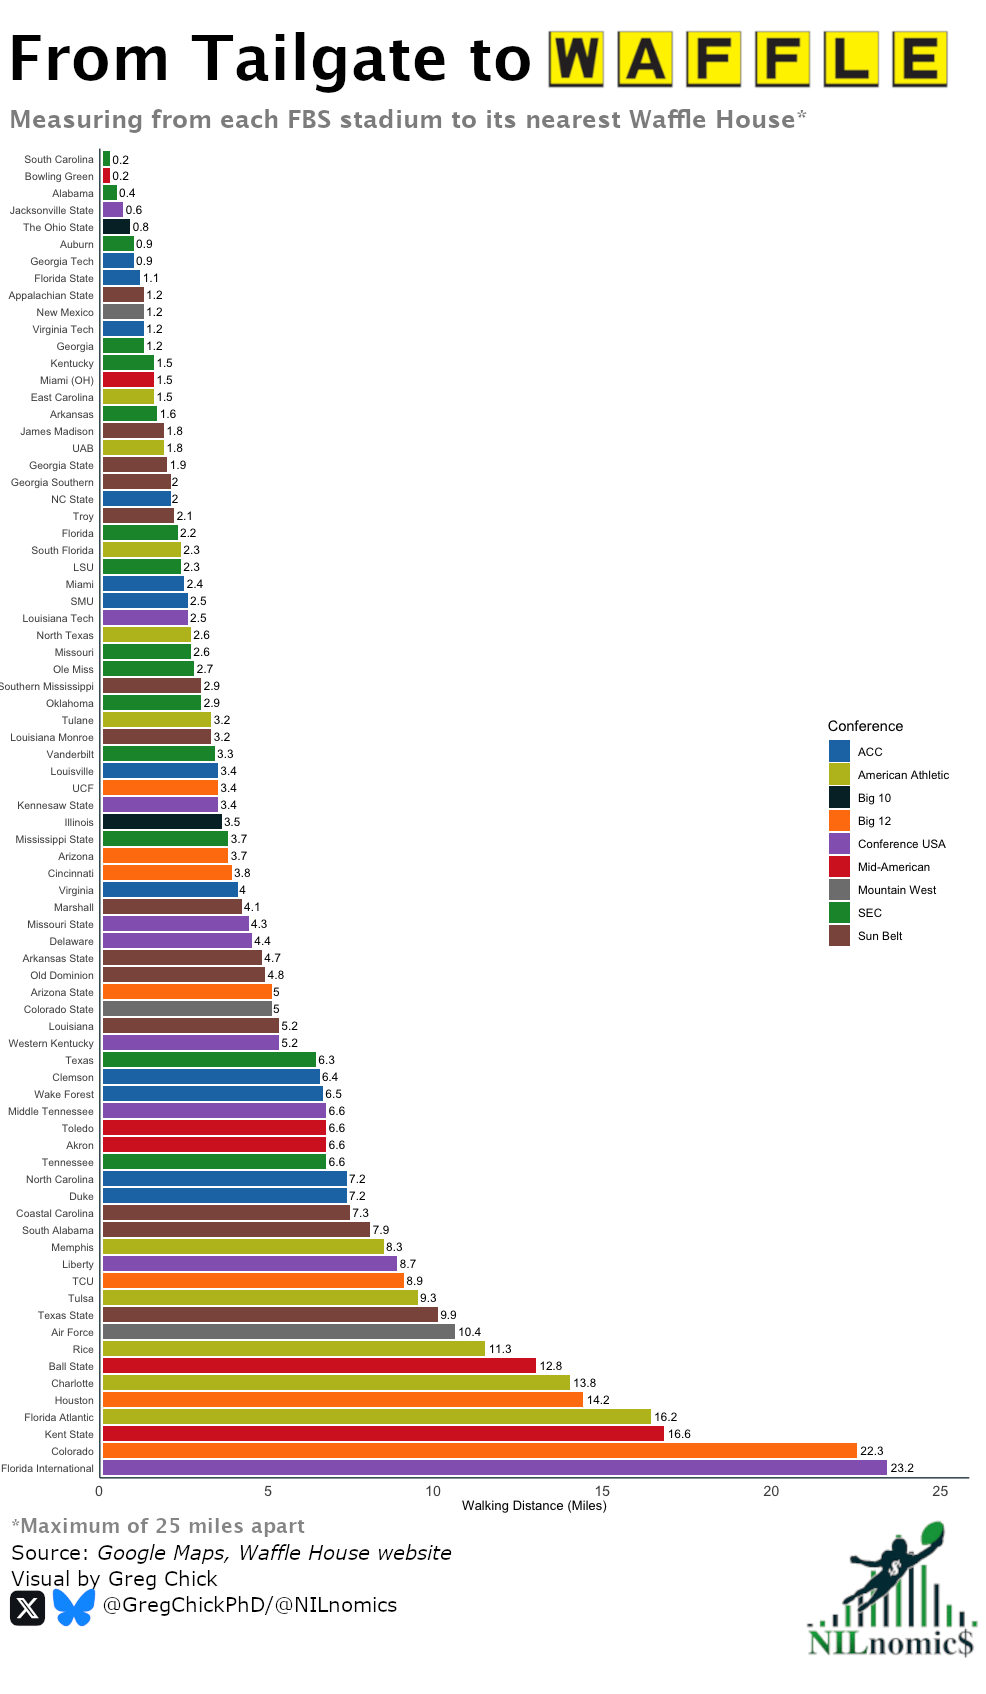
Quick Takeaways:
It is true that BGSU is the top ranked school - showing a mere 0.2 mile walk from Doyt Stadium across Wooster Street to the greatest breakfast chain mankind has created.
I capped the distance at 25 miles. No one is walking more than a mile but in case someone wanted to schlep to one in their car I thought 25 seemed reasonable. But if you wanted to know which schools are furthest from a Waffle House, that would be Oregon State (1150 miles) and Oregon (1108). Wonder if Phil Knight had anything to do with this. You can also look at the data yourself, too.
Interestingly, SEC has the most schools with 15 while the B1G has only 2. Maybe we’ve just discovered why the B1G is so insecure compared to its big brother.
Analyst’s Desk
This analysis required me to enter the city of each stadium into the Waffle House website’s locations page to find the closest location to the city. From there I just used Google Maps to enter the stadium’s name and the city of the nearest Waffle House location. Using the walking distance estimator, I used the first Waffle House that popped up to identify the closest location. To make this chart a bit easier to read, I did exclude all the institutions with a Waffle House more than 25 miles away. As you can see in my Quick Takeaways, I noted the stadiums furthest away from a Waffle House, but you can find all the FBS stadiums/Waffle House distances in the raw data.
🏒 College Hockey Corner 🏒
This week I wanted to dive into the TV ratings of the Frozen Four championship. Doing so required me to put together two separate graphs. First, I wanted to compare the Frozen Four to the NCAA March Madness Championship as well as the BCS/CFP Championship games. I think you need the context of college hockey versus other college sports to understand where it stands in the hierarchy. From there, I thought a chart focusing just on college hockey allowed some of the nuances and ups/downs to be a bit clearer. Hopefully you agree.
Here’s hockey vs. basketball/football:

And here’s just a chart on college hockey championships:

Quick Takeaways:
While you can see turbulence in football/basketball, the numbers are relatively so low for hockey you don’t see it in the first graph.
I can’t help but notice BC’s titles are downturns as well as UMass having a middling ratings performance. BU’s title is pretty high. Does this mean the northeast is or isn’t willing to tune in to see a local team compete for a championship?
How does Minnesota drop from 653 million in 2018 to 321 in 2019?
Who would have guess Quinnipiac would have the highest ratings at 808 million?
Analyst’s Desk
This was a difficult analysis to produce. I don’t have access to Nielson ratings directly so I’m relying on indirect sources. For this analysis, I found some information from here, here, and here. Sports Media Watch provided the ratings for basketball and football ratings.
📖 What I’m Reading/Listening To 🔉
I’m always on the lookout for anyone breaking down college sports and especially the business side of the industry. Here’s this week’s best listens:
Born to be a Sports Agent - an interesting interview with an FCS AD (East Washington) to hear his perspective on the post-House world.
The Sickos Committee Podcast - did I tell you how funny these guys are?
Thanks for reading through this week’s issue.
I love looking over data on college sports arenas - no matter the sport or metric. But I never saw myself measuring the distance between football stadiums and Waffle Houses. But here I am. Hope you enjoyed it as much as I did.
Until next time,
Greg Chick, PhD
Data Analyst
📩 Know someone who cares about the future of college sports? Forward this email or share the subscription link.
💬 Got feedback or a topic you want me to cover? Reply to this email - I read everything!
🖥️ The NILnomics website is your home for all NILnomics content.
⌨️ R code is available at my GitHub here.
📁 FOIA documents are available from my Google Drive here.

NILnomics is an independent data-driven newsletter uncovering the real numbers behind college sports finances with sharp insights, clear visuals, and exclusive datasets. Please send any thoughts, questions, or feedback to me at [email protected] and please follow me on X @NILnomics. Don’t forget all our data is available on Kaggle, code on GitHub, and FOIA documents on GoogleDrive. See you next week!
Reply