- NILnomics
- Posts
- From Kickoff to Cash Flow: Women’s Soccer Financials Revealed
From Kickoff to Cash Flow: Women’s Soccer Financials Revealed
Diving deep into a less analyzed sport

Good morning and thank you for taking the time to read NILnomics. This week I’ll be simping for women’s soccer (I’ll explain, promise). Today’s analysis will be:
Operating budgets - I looked into how much schools are spending on women’s soccer
Budgets in perspective - looking at overall athletic budgets, what percent is being spent on women’s soccer?
College hockey - I put regular powerhouse North Dakota under the (sankey) limelight
Pour a drink. Get comfortable. Let’s get into it.
If you’re not subscribed already, please click subscribe below to get NILnomics in your mailbox each and every week - it’s free!
The soccer mom army ⚽️
Last week I posted operating budgets for every school and sport for the last 7 years. I knew this was valuable data that had never been widely shared before. It shows how athletic departments spend their resources in ways that have never been seen before. But I didn’t know who, if anyone, would see it.
Turns out - the women’s soccer community latched on. Specifically, this post got significant (50k!) engagement:
🚨Some pretty interesting data on how much money many of the large Power 4 Women's Soccer programs lost last year.
— ECNL/GA/Recruiting/College Soccer (@ImYouthSoccer)
6:00 PM • Jul 14, 2025
This tweet (and several subsequent tweets that @ImYouthSoccer made going over the data I shared) drove me from under 100 followers on X to over 260. Newsletter subscribers went up significantly.
To those new subscribers who are here for the first time, let me say hello! And thank you! And to show my appreciation, I’m going to dig into women’s soccer financial data a bit this week and see what I can add to the discourse that I started. Let’s look at the women’s soccer operating budgets across the country:
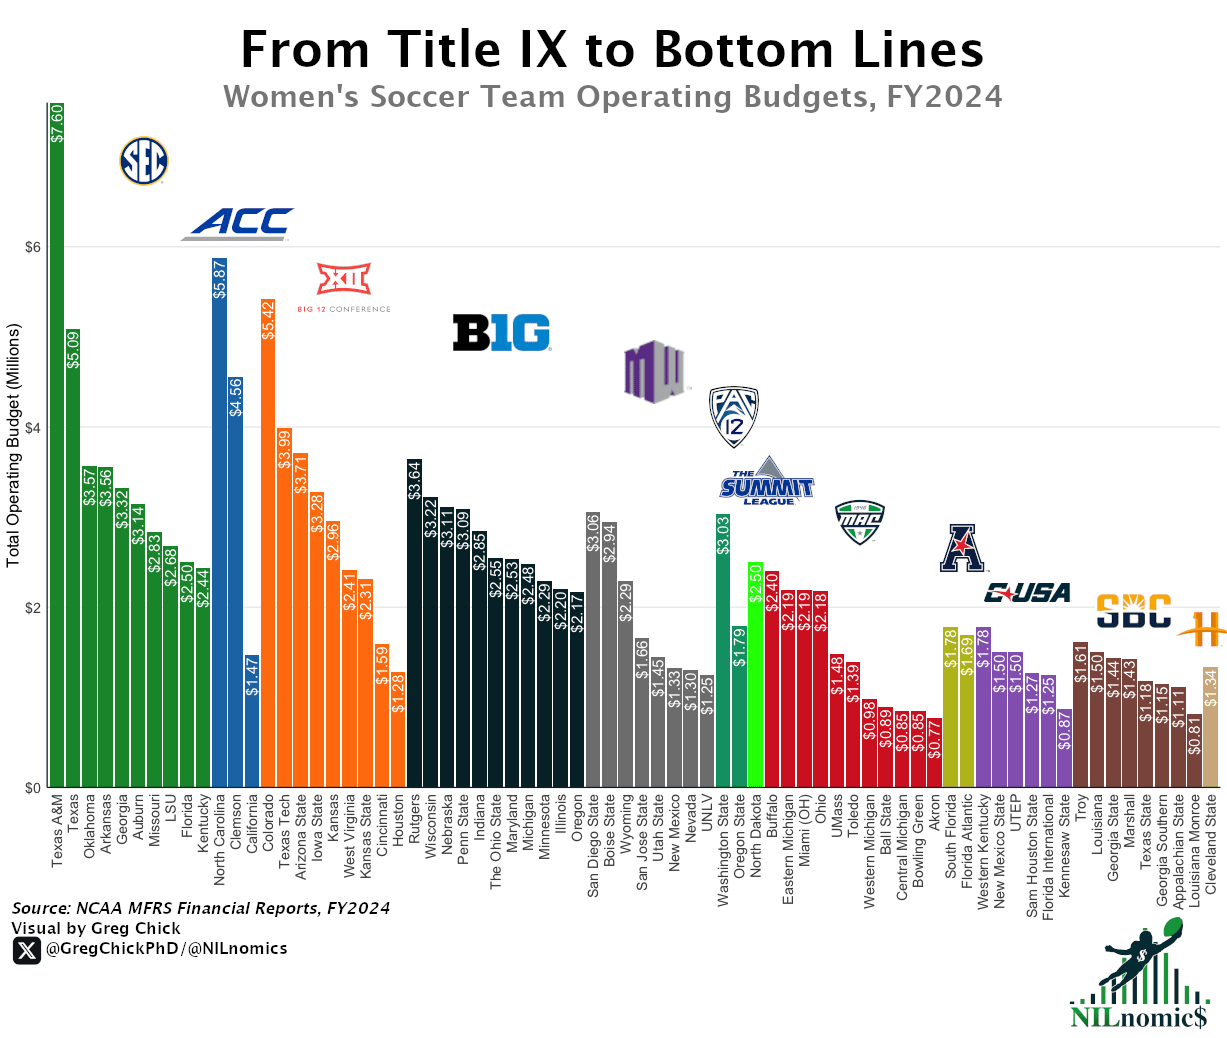
Quick Takeaways:
I make a lot of graphs comparing conference data points, and the general pattern I see in other analysis repeats here: the Power 4 reign supreme.
Not knowing anything about women’s soccer, I’m surprised how few programs there are. It’s not as ubiquitous as football and basketball (the main sports I run analysis on).
What’s interesting is how the ACC/Big 12 are ahead of B1G in this chart. That’s uncommon. Clearly UNC, Clemson, Colorado, and Texas Tech are all in on women’s soccer.
The number of mid-major schools that are matching what some of the lower level P4 schools is striking. Clearly the $2 million mark is a threshold that many mid-majors can/could/should afford and that the top P4 schools aren’t interested in surpassing.
Analyst’s Desk
The data for this analysis (and all the charts in this week’s newsletter) comes from the annual financial reports NCAA institutions must file that I have been able to retrieve. I scrape those documents for data, post them online (have I mentioned for free?) for anyone to consume, and run analysis like these on the data. This data comes from all the expense categories (travel, athletic student aid, coaching salaries, equipment, etc) for women’s soccer and is added up by school and sorted by conference.
If this is your first time seeing me use this data, just note that I only have it on public schools. There are also public schools that won’t give them to anyone who isn’t a legal resident or won’t pay a ridiculous fee. Thus, there are many public schools missing. If you live in AR, SC, VA, TN, or work at a private school don’t be afraid to message me.
Lastly, I should note that revenue/expenses that are reported but not identified as being connected to a specific team is left off this and all subsequent analysis.
Looking a bit closer 🙃
Not knowing anything about women’s soccer, I wasn’t overly shocked by what I saw here. The power 4 conferences are spending the most money on women’s soccer. That could likely be said for every sport (which I may get to analyzing at some point…).
But that is still an insufficient analysis. I decided to dig a bit deeper. The following chart looks at the same data a bit differently. First, I show the school’s overall athletic budgets. Then, I look at what percentage of that overall budget the above women’s soccer budget takes up.
My main idea in doing this graph was to have some perspective. While the women’s soccer operating budgets show the real amounts, zooming out into what % of overall budget is being spent on the sport adds a lot more context.
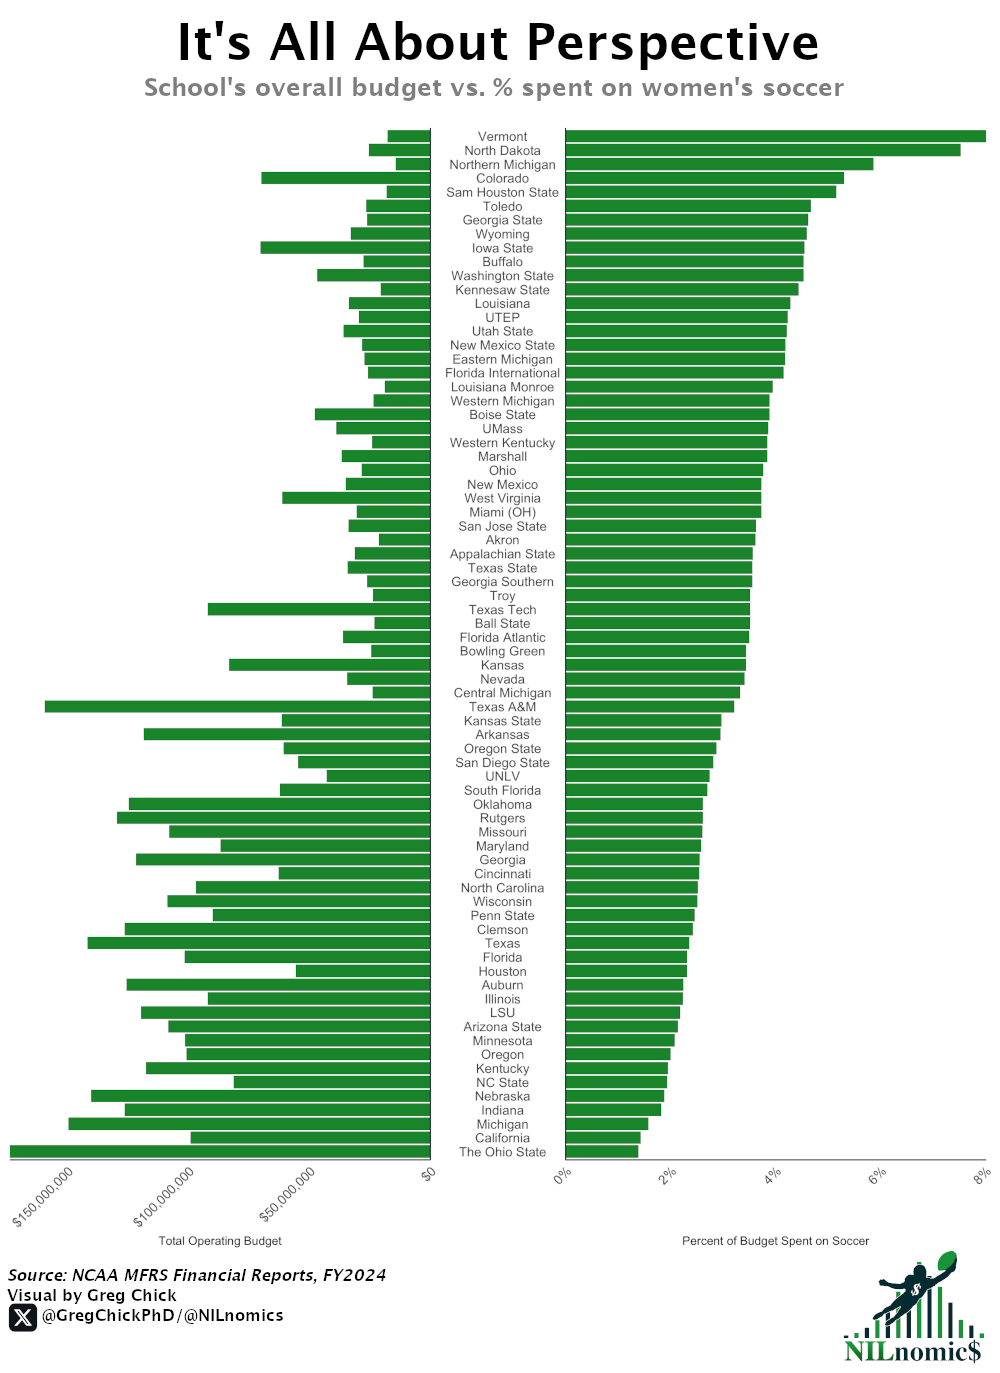
Quick Takeaways:
There is at noticeable disparity in what % of operating budgets are spent on women’s soccer, from 1.4% (Ohio State) to 8% (Vermont).
To my eye, all those schools above (and including) Central Michigan, at 3.3% of operating budget, come from noticeably different sized overall budgets. And only 5 of them come from P4 schools (and all from the Big 12).
Interesting to me that Ohio State clearly has the biggest overall budget but also the lowest percentage allocation to women’s soccer.
Perhaps another layer to add to this chart would be the team’s success. But I wonder if Vermont, Colorado, and Iowa State are as competitive as I would think/hope they’d be given this data.
Analyst’s Desk
As I mentioned, I took the overall athletic department operating budgets and divided them by the women’s soccer budgets to determine how much money was being allocated to the sport. Then I stacked that next to the overall budget. It’s an interesting comparison.
🏒 College Hockey Corner 🏒
3 weeks ago I posted a sankey chart of reigning DI men’s champion Western Michigan University’s revenue/expenses. I got some great feedback on Reddit. One piece that came out of that was a request to do the same analysis for the University of North Dakota. And who am I to not answer to a social media mob? It’s a bit of a theme this week 🤣
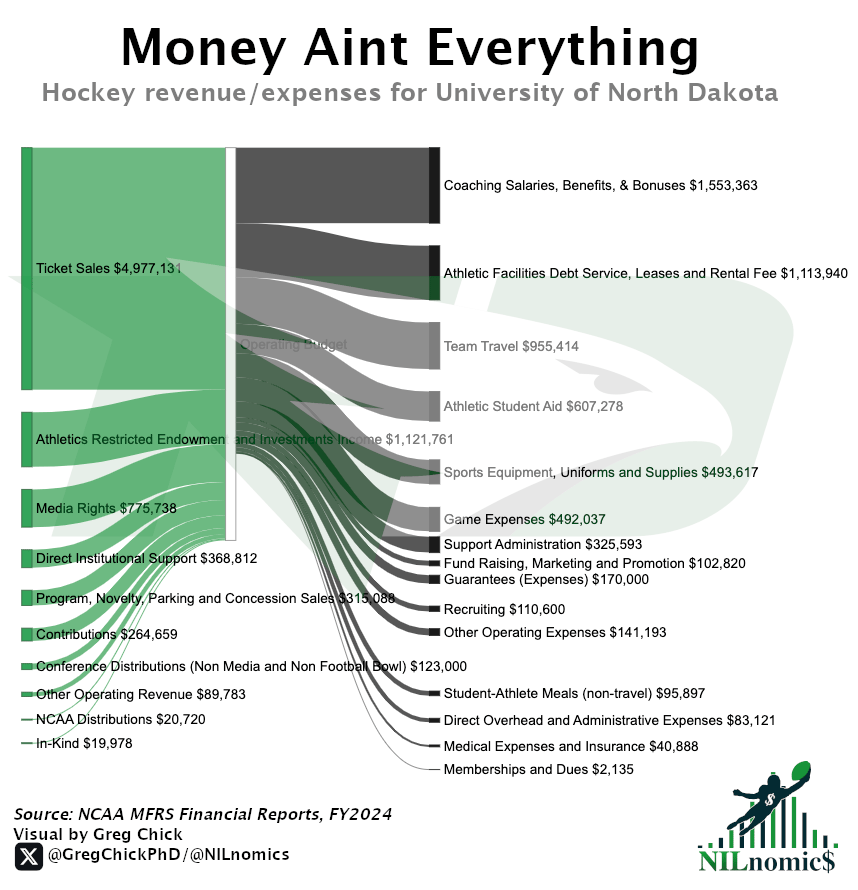
Quick Takeaways:
DI Men’s ice hockey teams can make a profit! At least this one does.
Look at the income they are getting from ticket sales. There’s a reason a few weeks back I found UND is the #1 school in ticket revenue.
I’d have to dig deeper, but obviously the 2nd biggest expense category being facilities related costs seems notable.
Though last week I found UND to be #3 in travel costs, it is notable that travel costs are higher than their student aid budget.
Analyst’s Desk
There wasn’t anything I did differently here than I did 3 weeks ago. Just using the (free!) NCAA finance data I’ve put together and drilling down to North Dakota’s Men’s Ice Hockey team.
📖 What I’m Reading/Listening To 🔉
I’m always on the lookout for anyone breaking down college sports and especially the business side of the industry. Here’s this week’s best listens:
The Joe Pomp Show - I was just introduced to his content and find this episode is a great overview of the House settlement. And it’s brief. Worth a listen.
NIL Clubhouse - the guys break down how the NIL Go Clearinghouse rollout has gone. Spoiler alert - not great.
Final Thoughts
Thanks for reading this week’s issue.
I’m writing this as I head out for a semi-vacation up in Maine. Fingers crossed you’ll see more content in your mailbox next week. Here’s hoping 😀
Until next time,
Greg Chick, PhD
Data Analyst
📩 Know someone who cares about the future of college sports? Forward this email or share the subscription link.
💬 Got feedback or a topic you want me to cover? Reply to this email - I read everything!
🖥️ The NILnomics website is your home for all NILnomics content.
⌨️ R code is available at my GitHub here.
📁 FOIA documents are available from my Google Drive here.

NILnomics is an independent data-driven newsletter uncovering the real numbers behind college sports finances with sharp insights, clear visuals, and exclusive datasets. Please send any thoughts, questions, or feedback to me at [email protected] and please follow me on X @NILnomics. Don’t forget all our data is available on Kaggle, code on GitHub, and FOIA documents on GoogleDrive. See you next week!
Reply