- NILnomics
- Posts
- How much does an FBS win cost?
How much does an FBS win cost?
Comparing football operating budgets to wins
Good morning and thank you for taking the time to read NILnomics.
This week I’m going to explore a question I realized I am uniquely positioned to answer - how much does it cost to win an FBS college football game? To answer that, you would need to know the football team’s operating budget (read - not the overall athletic department operating budget, but the football team specifically). And I just so happen to have that data (and you can too!). If this topic sounds interesting to you, then strap in for a deep dive.
Football win/cost - focusing on how much it costs for each win in FBS football
Pour a drink. Get comfortable. Let’s get into it.
If you’re not subscribed already, please click subscribe below to get NILnomics in your mailbox each and every week - it’s free!
💵 Paying for that dub 💸
This analysis came to me when an episode of the Sports Wise podcast asked the question, rhetorically, what it costs to get a win in FBS football. Gabe and his guest chuckled at a bit when they conjectured what it may be, but it made me think I could answer the question. So here we are.
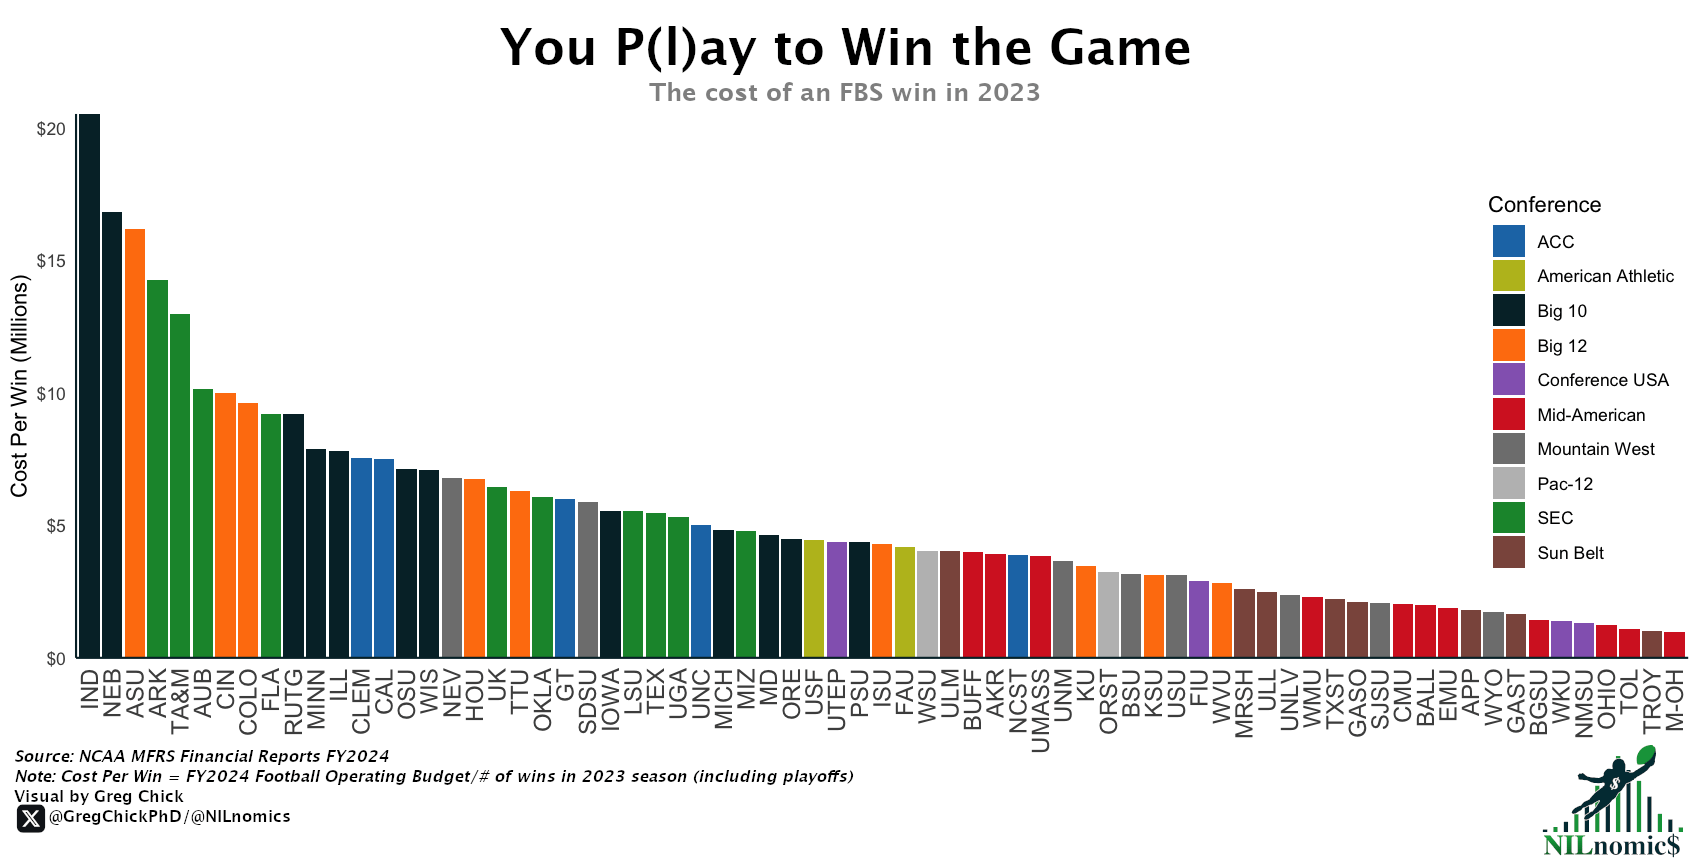
This first chart plots the data as simply as possible - by institution without regard for conference or operating budget. And yes, just for interpretation, this data does mean that Indiana spent $20.5 million for each of their 3 wins in the 2023 season. No, I’m not going to chart (like I did with Michigan a few weeks ago) how many full scholarships that could pay for.
Quick Takeaways:
Schools with the biggest budgets are always going to have higher win per dollar rates (and the inverse - schools with the lowest budgets have the lowest win per dollar rates). That’s why, just using the legend, you can see the colors for the G6 are dominant on the right-hand side while the P4 is dominant on the left-hand side.
Clearly, at 3-9 Indiana had a horrible 2023 season. But when you think about the $61 million their football team cost, it gets more alarming.
I find it interesting that Michigan, who went undefeated en-route to the national championship, is almost exactly in the middle. Having the 4th highest operating budget can be obscured by hitting 15 wins pretty easily.
I have a soft spot for the MAC as a BGSU-alum, and the fact many of them are bundled up on the right hand side suggests how much parity the conference has.
Analyst’s Desk
To get to the results, first I took all the schools I had the latest (FY2024) annual NCAA MFRS financial reports for and honed in on the operating budgets of their football teams. (Note - many schools are missing because only public schools have to respond to records request, many schools charge for records, and others have other bureaucratic barriers to get the reports). Then a quick look at College Reference for the 2023 season wins/losses gave me all I needed to calculate the cost of a win per game.
One note here is that conferences are based on current, 2025 membership. This makes me think I need to start a database of historical conference membership to reference later. Will get on that.
Conference Context
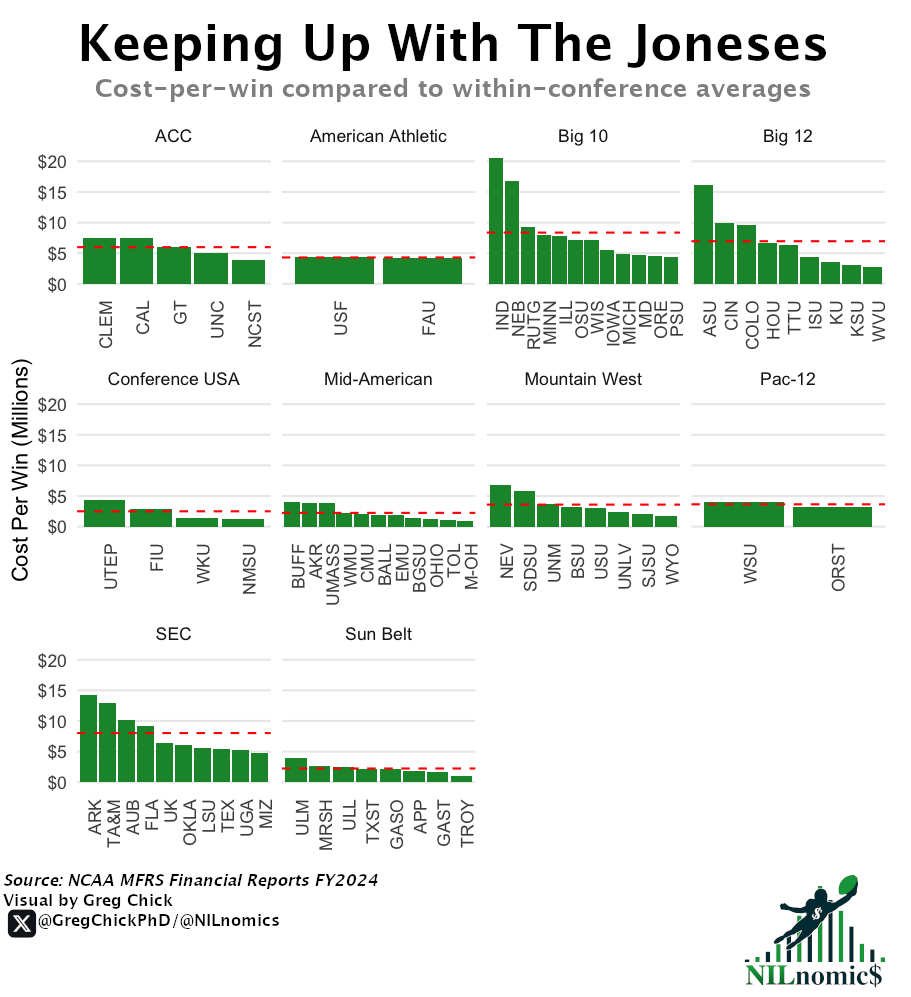
As I suggested, there are clear conference specific trends at play in the earlier graph. When schools have big budgets (SEC or B1G) they’ll naturally have higher cost per win rates compared to lower resourced schools. In order to give a bit more context, I zoomed in on each individual conference here:
Quick Takeaways:
To me, anyone whose cost per win is less than Ohio State and Michigan are where the value is in the B1G. Penn State and Oregon are swinging above their weight class.
Similarly, the Tigers from Mizzou also outclass the SEC as their $52million operating budget is dwarfed by Texas and Georgia but still have a better cost per win rate.
It’s interesting to compare UNC/NC State. UNC has $5 million more in their operating budgets and NC State has 1 more win. Funny that NC State walks away with the better cost per win rate. Know your fractions!
Analyst’s Desk
I calculated the average per-win-rate at the conference level and drew that as the red line for each conference. Then I just plotted each school individually, by conference, in descending order.
Does 💰️ = Wins ✅ ?
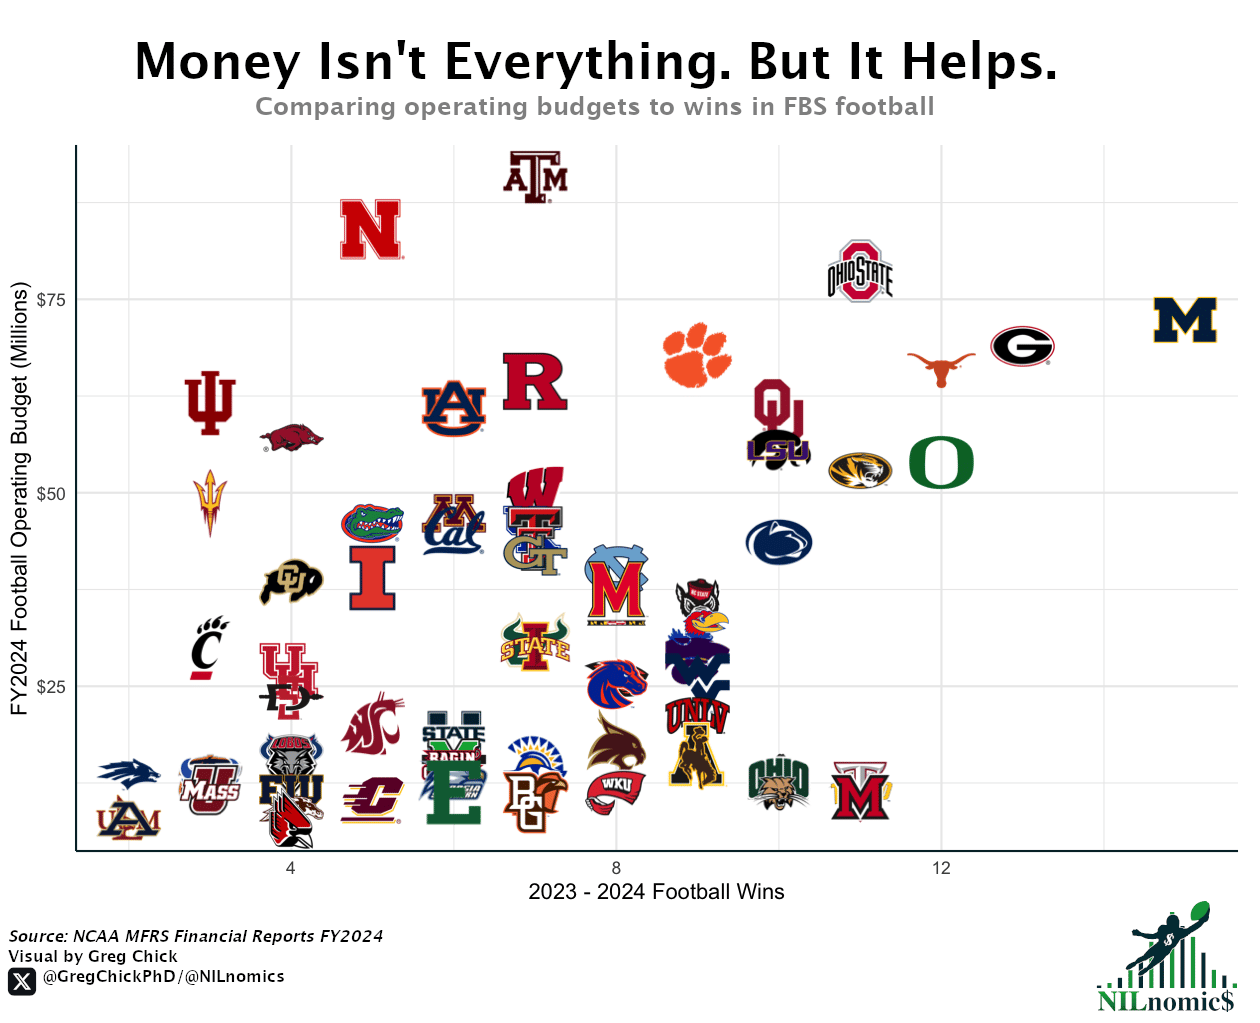
Let’s be clear - operating budgets and wins have a weak correlation (0.338 to be exact). So money isn’t everything. But, it doesn’t hurt. Here’s how they compare:
Quick Takeaways:
If you stare at the chart long enough, you can see a general divide among the top and bottom half that represents the P4/G6 differences. Can’t unsee it once you look at it this way.
Nice to see UMass, in it’s pre-MAC Conference era, in the worst quadrant of the graph (bottom-left, lowest budget and least amount of wins).
Again, Indiana sticks out. Up there on the top left as the only school above $50 million with less than 4 wins. That hurts. It’s to know they’d redeem themselves and squeeze into the playoffs the next year.
This graph doesn’t have any NIL in it. You’d think if it was that the gap between the P4/G6 would be a little highway in the middle of the graph.
The Texas Tech/Texas A&M comparison where both are at 7 wins but have a $45 million operating budget disparity is noteworthy.
Analyst’s Desk
Straightforward plotting of football operating budgets and football wins.
📊 Other Data Worth Seeing 📊
First time writing a section like this so we’ll see how it goes. I saw lots of good data come out in the college sports space and thought I’d share what I found. These may come up as topics in future issues. Worth your time.
Opendorse - the leading NIL marketplace released a report showing some amazing numbers behind what’s really happening in college athletics. For example, the average Big 12 team is allocating 23.1% of it’s revenue share to quarterbacks compared to 15.1% in the SEC. Just a goldmine of (free) data.
Academia - a new research article looks at the impact of abortion policies on female college athlete recruiting. Not being political here, just highlighting credible quantitative research when I see it out in the field. Given I have an academic background, I appreciate it when researchers use econometric research methods in this space.
Bureau of Business and Economic Research - University of Montana and BBER conducted an intense economic study of the impact of college football on the institution and region’s economy. Some solid research that’s worth reading.
🔉 What I’m Listening To 🔉
I’m always on the lookout for anyone breaking down college sports and especially the business side of the industry. Here’s this week’s best listens:
NIL Clubhouse - the newest episode dives into Trump’s executive order and had some interesting guests around DIII NIL opportunities and financial literacy for student athletes
Trustees and Presidents - a great podcast that goes into the university president’s perspective on the athletics space and higher education.
Final Thoughts
Thanks for reading this week’s issue.
I’m always thinking about how best to use the sport level data in new and exciting ways. I hope you found this to be an interesting look at how schools are performing relative to their resources. Thanks again for your time. Now finish your beverage 😀
Best,
Greg Chick, PhD
Data Analyst
📩 Know someone who cares about the future of college sports? Forward this email or share the subscription link.
💬 Got feedback or a topic you want me to cover? Reply to this email - I read everything!
🖥️ The NILnomics website is your home for all NILnomics content.
⌨️ R code is available at my GitHub here.

NILnomics is an independent data-driven newsletter uncovering the real numbers behind college sports finances with sharp insights, clear visuals, and exclusive datasets. Please send any thoughts, questions, or feedback to me at [email protected] and please follow me on X @NILnomics. Don’t forget all our data is available on Kaggle, code on GitHub, and FOIA documents on GoogleDrive. See you next week!
Reply